The most important factor in determining if a satellite image meets your needs is to see if it has the right resolution. In a regular photograph, images with higher spatial resolution provide a more accurate representation of reality. However, unlike a photograph, satellite images have three types of resolution: temporal, spatial, and spectral.
Spatial Resolution
If a satellite has a resolution or data of 30 meters, it means that most of its bands capture pixels with a diameter of about 30 meters (this may vary with latitude). In other words, a 30-meter pixel represents an area on the ground 30 meters wide.
Below is a table showing three images with different resolutions for the same area. Note that the image on the right captures fewer details than the one on the left.
The higher the image resolution, the more expensive it is to capture, process, and distribute. Part of this is simply due to image size. If we have a raster of an area of 100 kilometers (100,000 meters) on each side and it contains only 1 band with 8 bits per band, then the raster size for each resolution is:
|
1 Meter Resolution |
10 Meter Resolution |
30 Meter Resolution |
|
100,000 x 100,000 = 10,000,000,000 |
10,000 x 10,000 = 100,000,000 |
3,000 x 3,000 = 9,000,000 |
|
10 Gigabytes |
100 Megabytes |
9 Megabytes |
As spatial resolution increases, the raster size increases by the square of the resolution. This makes spatial resolution critical for monitoring, as we need enough resolution to see what interests us on the ground but not so much that we cannot effectively process the data.
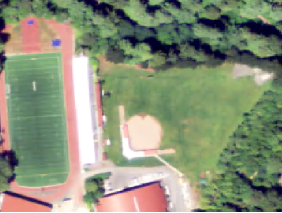
Spatial resolution, or pixel size, describes the level of detail in each image. With a resolution of 250 meters, you can distinguish between land and water and observe patterns on a country scale, but not much more. As you reach a resolution of 3 meters or less, you can start to distinguish objects like cars, buildings, or sports fields. With a resolution below one meter, you can begin to see details such as trails or individual trees more clearly.
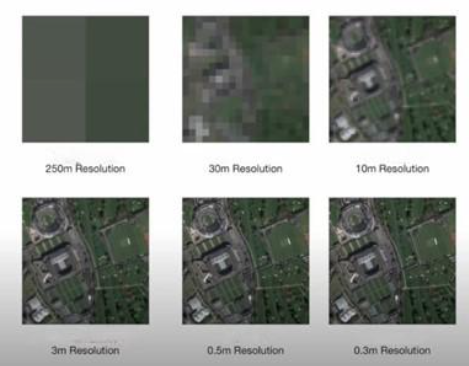
As a general rule, 3 pixels are needed to clearly identify an object. For example, if you have an image with a resolution of 3 meters, you will be able to identify any object that is 9 meters or larger.
It is important to obtain the correct level of spatial resolution. There are simply things that cannot be resolved or determined based on lower spatial resolution images.
Higher spatial resolution is always desirable for more precise details, but obtaining higher-quality images requires trade-offs in terms of temporal resolution or cost. The amount of detail needed varies greatly depending on the objective.
Spatial Resolution vs. Scale
Spatial resolution refers to the dimension of the pixel size representing the area covered on the ground. For example, if the area covered by a pixel is 5 x 5 meters, the resolution is 5 meters. The higher the image resolution, the smaller the pixel size, and the greater the detail. This is the opposite of scale. The smaller the scale, the less detail. For example, an orthophoto displayed at a scale of 1:2000 shows more detail (appears enlarged) than one displayed at a scale of 1:24,000 (appears reduced). However, if this same orthophoto has a pixel size of 5 meters, the resolution remains the same regardless of its display scale, as the physical pixel size (the area on the ground represented by a single pixel) does not change.
The scale of the first image below (1:50,000) is smaller than the scale of the second image (1:2500); however, the spatial resolution (cell size) of the data is the same.

The spatial resolution of the data used in the first image below is lower than the spatial resolution of the data used in the second image. This means that the pixel size of the data in the first image is larger than that of the data in the second image; however, the scale at which each is displayed is the same.

Spatial resolution is the size of a pixel, the smallest visible point for the sensor. In reality, a remote sensing satellite sensor perceives an image through its instantaneous elliptical field of view (IFOV), which is then processed into a square pixel. Depending on the distance to the object and the equipment’s capabilities, remote sensing can be conducted with low, medium, or high spatial resolution. For example, drones flying close to the ground can capture images with exceptionally high spatial resolution. Satellites, which are much farther from Earth, can capture remote sensing images of the planet’s surface in any of the three resolutions, depending on the sensor. Considering that remote sensing technology is constantly developing, the classification into low, medium, and high spatial resolution is merely a reference point. In the 1980s, a spatial resolution of 60 meters per pixel on NASA’s Landsat satellite was considered relatively high, but today it is considered excessively low.
30 cm is the best spatial resolution option possible for remote sensing in commercial satellites.
Real examples of spatial resolution in remote sensing, these three satellite images of the Jangokh neighborhood in Tashkent (Uzbekistan), show the difference in spatial resolution. The 0.4 m/px image from Kompsat-3A clearly shows buildings, roads, and even cars, but in most cases, that level of detail requires a fee. The quality of the other two images (30 m/px and 10 m/px) is not as sharp, but these satellite images are free.
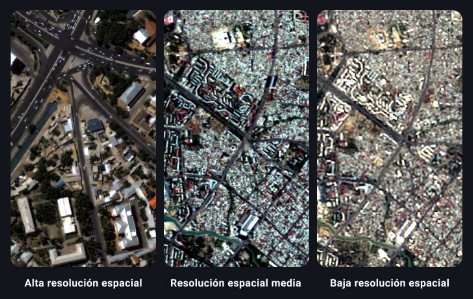
Today, a vast amount of medium and low spatial resolution remote sensing images are available, mainly from the Sentinel and Landsat satellites. These data, which cover 50 years and include various spectral bands, are available to the public for free and can be used in different contexts.
It is easy to obtain medium and low-resolution remote sensing images thanks to the abundance of resources available online. The EOSDA LandViewer satellite data online service alone provides access to eight free Earth observation datasets. These datasets come from Sentinel 2, Landsat 8 OLI and TIRS, Landsat ETM+, and MODIS. By using different data sources, users can examine, analyze, and download updated images with the following characteristics:
-
Spatial resolution from 10 to 500 m/pixel;
-
Revisit period between 2 and 16 days;
-
Spectral resolution from 4 to 12 bands with the option to create custom band combinations.
The abundance of information available from the numerous spectral bands and their combinations makes these images incredibly useful despite their apparent lack of detail. With these remote sensing data, you can obtain information about a wide range of objects and their properties that would otherwise be inaccessible.
Historical Perspective
Our current wealth of remote sensing images in these categories is the direct result of the Landsat project, which began more than half a century ago. By visualizing and analyzing satellite images from 1982 in EOSDA LandViewer, you can obtain valuable information about the evolution of your study objects over time.
Low Level of Detail
Due to the lack of detail in these images, only large objects such as bridges, canals, or urban layouts can be distinguished. Even the Colosseum, whose dimensions are substantial, will appear as a dot.
Reduced Coverage Area
The higher the quality of an image, the less surface area it covers. This is why high-quality images are ideal for specific observation and research.
Lower Availability
Clouds can make it difficult to obtain data from satellites. But in high-resolution remote sensing, when satellites often deviate from a predetermined path, this becomes crucial.
Uses of High Resolution
High-quality remote sensing images, with a spatial resolution of 1 to 5 meters per pixel and less than 1 meter per pixel (very high spatial resolution), are useful in areas where maximum detail is needed for relatively small areas, such as:
-
Detection of diseases or pests in crops in precision agriculture;
-
Identification of soil erosion processes;
-
Detection of field boundaries and their mapping;
-
Livestock observation and management;
-
Deforestation detection and forest management;
-
Detection and mitigation of local anomalies;
-
3D city modeling.

Uses of Medium Resolution
Medium-resolution images (5-30 meters per pixel) can be used for tasks that do not require extreme precision but do require broad coverage. Some examples are:
-
Monitoring of crop health and growth;
-
Monitoring of moisture and nutrient content;
-
Monitoring of vegetation density;
-
Detection of pests and diseases;
-
Estimation of biodiversity loss in forest areas;
-
Identification of large-scale natural anomalies;
-
Monitoring of water bodies;
-
Analysis of urban expansion.

Uses of Low Resolution
Despite their lack of precision, low spatial resolution remote sensing (30-250 meters per pixel) captures a wide area and adds information by sampling spectral levels that other methods do not reach. Some of its application areas include:
-
Crop growth modeling;
-
Yield prediction;
-
Trend mapping;
-
Detection of large-scale anomalies;
-
Monitoring of large-scale infrastructure changes.
Image of low resolution (30 m/pixel) from Landsat 8 OLI and TIRS, showing general landscape features of a large area.
Thus, by selecting the most suitable spatial resolution for each task, you can perform it more efficiently and cost-effectively.

Temporal Resolution
The first concept is temporal resolution or “revisit.” It is the time it takes for the satellite to pass over the same location again. This is the first thing you should consider when evaluating a project. In other words, to know if a satellite platform serves your purpose, you must first understand the rate of change of the phenomenon you want to analyze and whether it can be measured with the satellite’s revisit time.
Low Temporal Resolution
A satellite with lower temporal resolution may revisit the same area several times a month. However, keep in mind that some of these visits, such as on days 5, 10, and 25, may be cloudy, making the data unusable.

High Temporal Resolution
A satellite with higher temporal resolution can revisit the same area almost every day. Even if there are cloudy days or days when the satellite could only capture part of the area of interest, much more useful information is still obtained for processing. This can be useful if you are trying to monitor crop changes, irrigation, or track short-duration events.
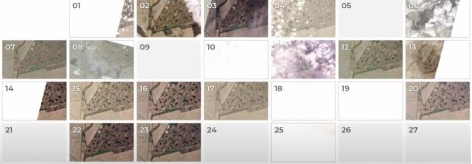
It is often easy to forget that raster images represent a snapshot in time for our Earth. As soon as raster data is captured, the Earth continues to change. This means that the raster only represents a short period of time. Additionally, for some rasters, like Landsat, we get snapshots twice a month, while MODIS captures them twice a day. These are the temporal resolutions for remote sensing data, but any raster layer will have a specific time period for which it is valid.
Spectral Resolution
We have already mentioned how rasters can have different numbers of bands. Black and white photos contain 1 band, while RGB images contain 3, and Landsat contains 7. Each band represents a range of spectral values from the electromagnetic spectrum. The range of the spectrum captured by each band and the number of bands is called the “spectral resolution.”
Radiometric Resolution
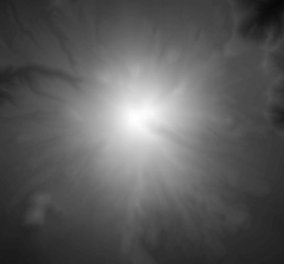
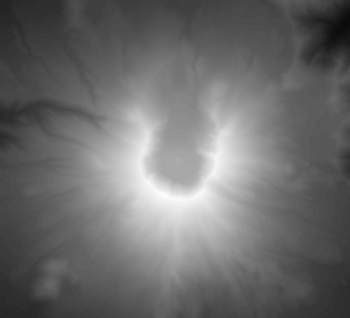
The last type of resolution is the number of bits for each raster band. 8-bit data used to be very common, but it only allows values from 0 to 255, or 256 values in total. Some of the newer satellites can produce more than 256 intensity levels for each band in a pixel, resulting in 16-bit remote sensing data. DEMs have always been distributed as 16-bit integers because Mount Everest is 29,029 feet high (8,848 meters), so a 16-bit value (from -32,767 to +32,767) is needed to capture the full range of elevations on Earth.
Putting It All Together
Choosing the correct resolution for rasters can determine whether you can successfully complete the task at hand, making it essential to carefully consider each type of resolution. The following image can help you remember the four different types of resolution.

While spatial resolution determines how detailed an image is, spectral resolution determines what information is included in the image.
Different parts of the electromagnetic spectrum can reveal hidden information that is not visible to the human eye. Therefore, having high spectral resolution allows you to uncover more of this hidden information.
The most basic type of spectral resolution is black and white or panchromatic. This allows us to see marked contrast within the visible light spectrum. Beyond that, we have colors ranging from the red, green, and blue parts of the spectrum.
Next, we have multispectral images. These cover the visible spectrum and parts of the infrared in specific ranges called bands. Finally, there are hyperspectral images that cover the visible spectrum and all ranges of the infrared.
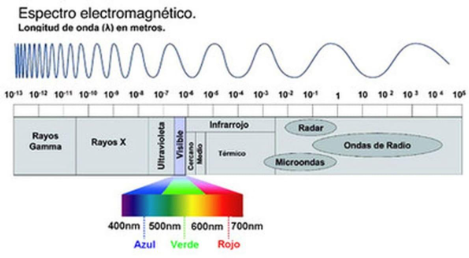
By covering a larger portion of the electromagnetic spectrum and increasing spectral resolution, we can perform a greater variety of analyses. For example, by comparing the amount of red and infrared light, you can assess the health of crops. Similarly, you can determine soil moisture content by comparing different bands.
The more spectral bands satellite images have, the more precisely you can identify the unique spectral signature of an object.
References
Alvaro Valenzuela, Karin Reinke, Simon Jones. A new metric for the assessment of spatial resolution in satellite imagers, International Journal of Applied Earth Observation and Geoinformation. Volume 114, 2022, ISSN 1569-8432. https://doi.org/10.1016/j.jag.2022.103051↑
Charles Toth, Grzegorz Jóźków. Remote sensing platforms and sensors: A survey. ISPRS Journal of Photogrammetry and Remote Sensing, Volume 115, 2016, Pages 22-36, ISSN 0924-2716. https://doi.org/10.1016/j.isprsjprs.2015.10.004↑
Suwanprasit, Chanida & Srichai, Naiyana. (2012). Impacts of spatial resolution on land cover classification. Proceedings of the Asia-Pacific Advanced Network. 33. 39. 10.7125/APAN.33.4.↑


